Back in the early days of our Whole Grains Council, which was founded in 2003, if you wanted a whole grain product from the grocery store, your options were largely limited to a loaf of bread, a box of granola, or a bag of brown rice. When it comes to whole grain food options today, however, food companies and consumers alike are thinking beyond bread. From frozen whole grain wafles and pancakes, to bags of popcorn seasoned with true oil or pink Himalayan salt, the options seem almost endless. This week we explored the recent explosion of whole grain choices by turning to our Whole Grain Stamp database.
The Oldways Whole Grains Council has been certifying the whole grain content of food products for well over a decade now. In fact, there are more than 11,000 products registered and approved to use our Whole Grain Stamp in 58 countries around the world. With a database that big, and a team of whole grain data geeks behind it, we cant resist diving in from time to time and taking a look at what it all says about whole grain trends and momentum.
Back in March, in a Whole Grains Council blogpost, we took a look at how much the average whole grain gram amounts on Stamped products had increased over time, and showed the growth in the number of companies using the Stamp (we now have more than 400 member companies based in 23 countries!). We also charted the growth in popularity of ancient grains like amaranth, sorghum, and quinoa (did you know that quinoa is now included in almost 10% of all Stamped products sold in the US, up from just 3% of products in 2011).
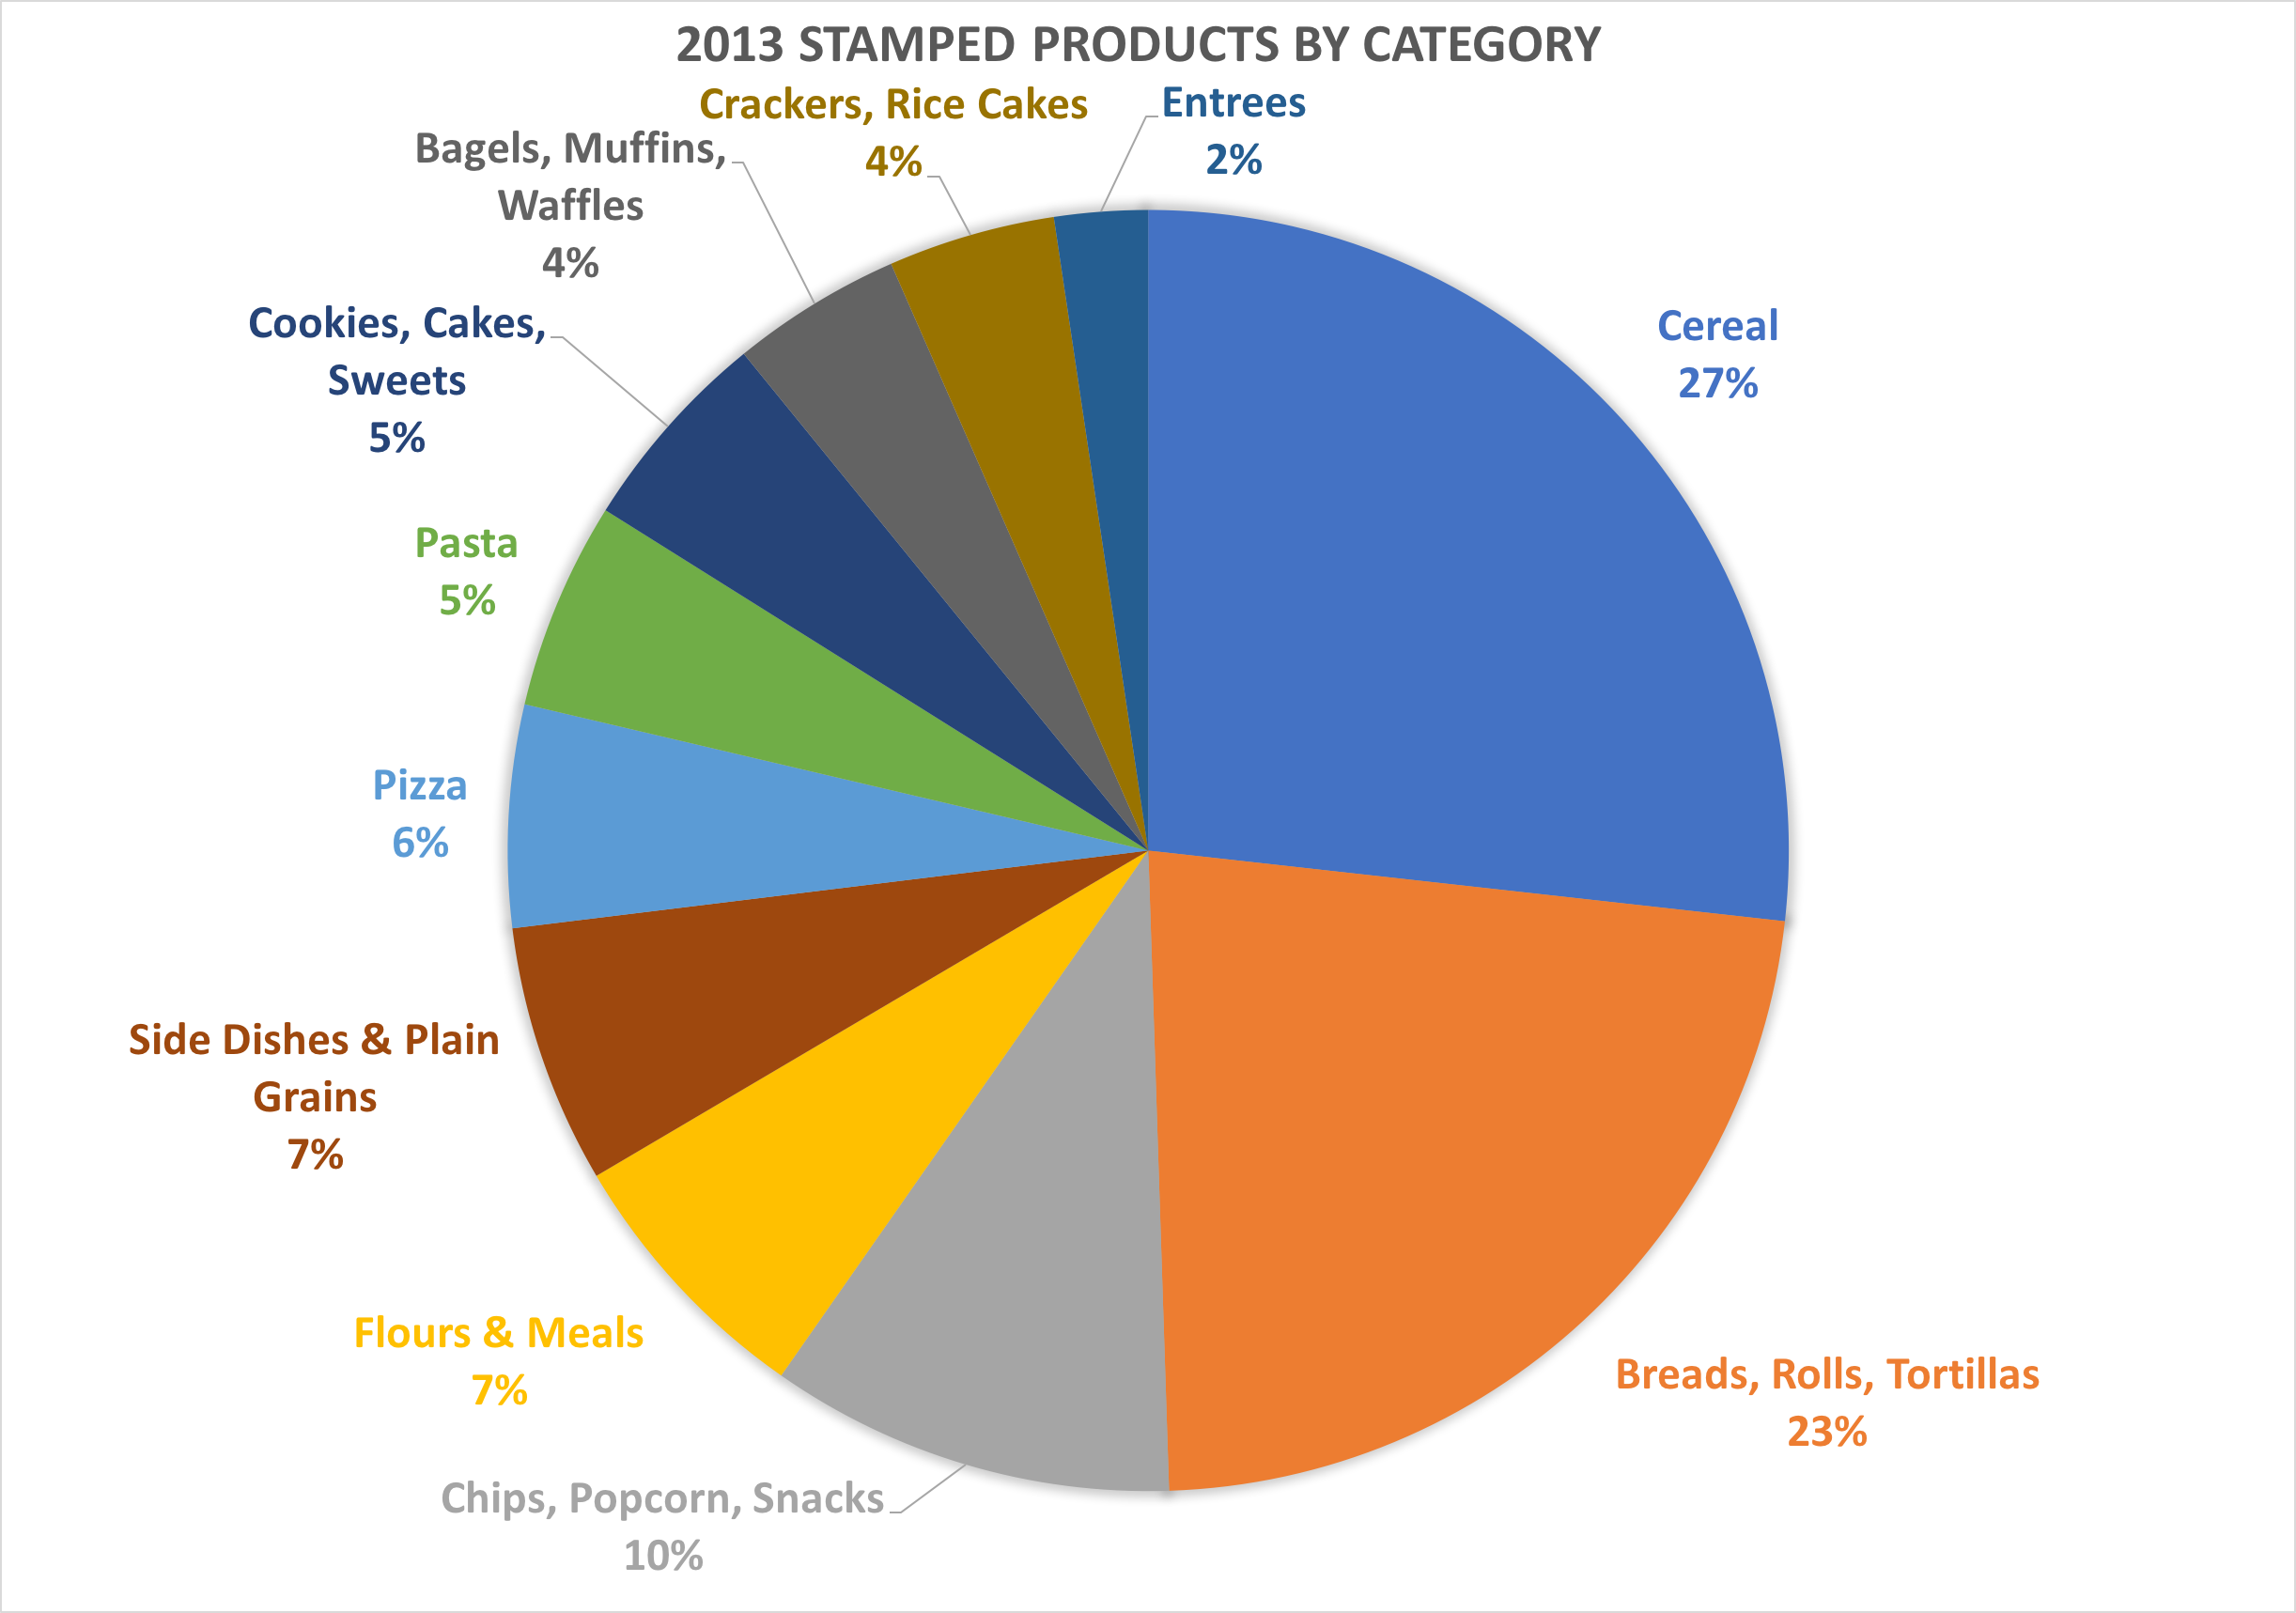
This week we turned our attention to the types of product categories represented in our database. While it’s very easy to tell that there are far more whole grain products on the market today than there were 10 years ago, we wanted to know if the data showed an expansion in the types of products being offered.
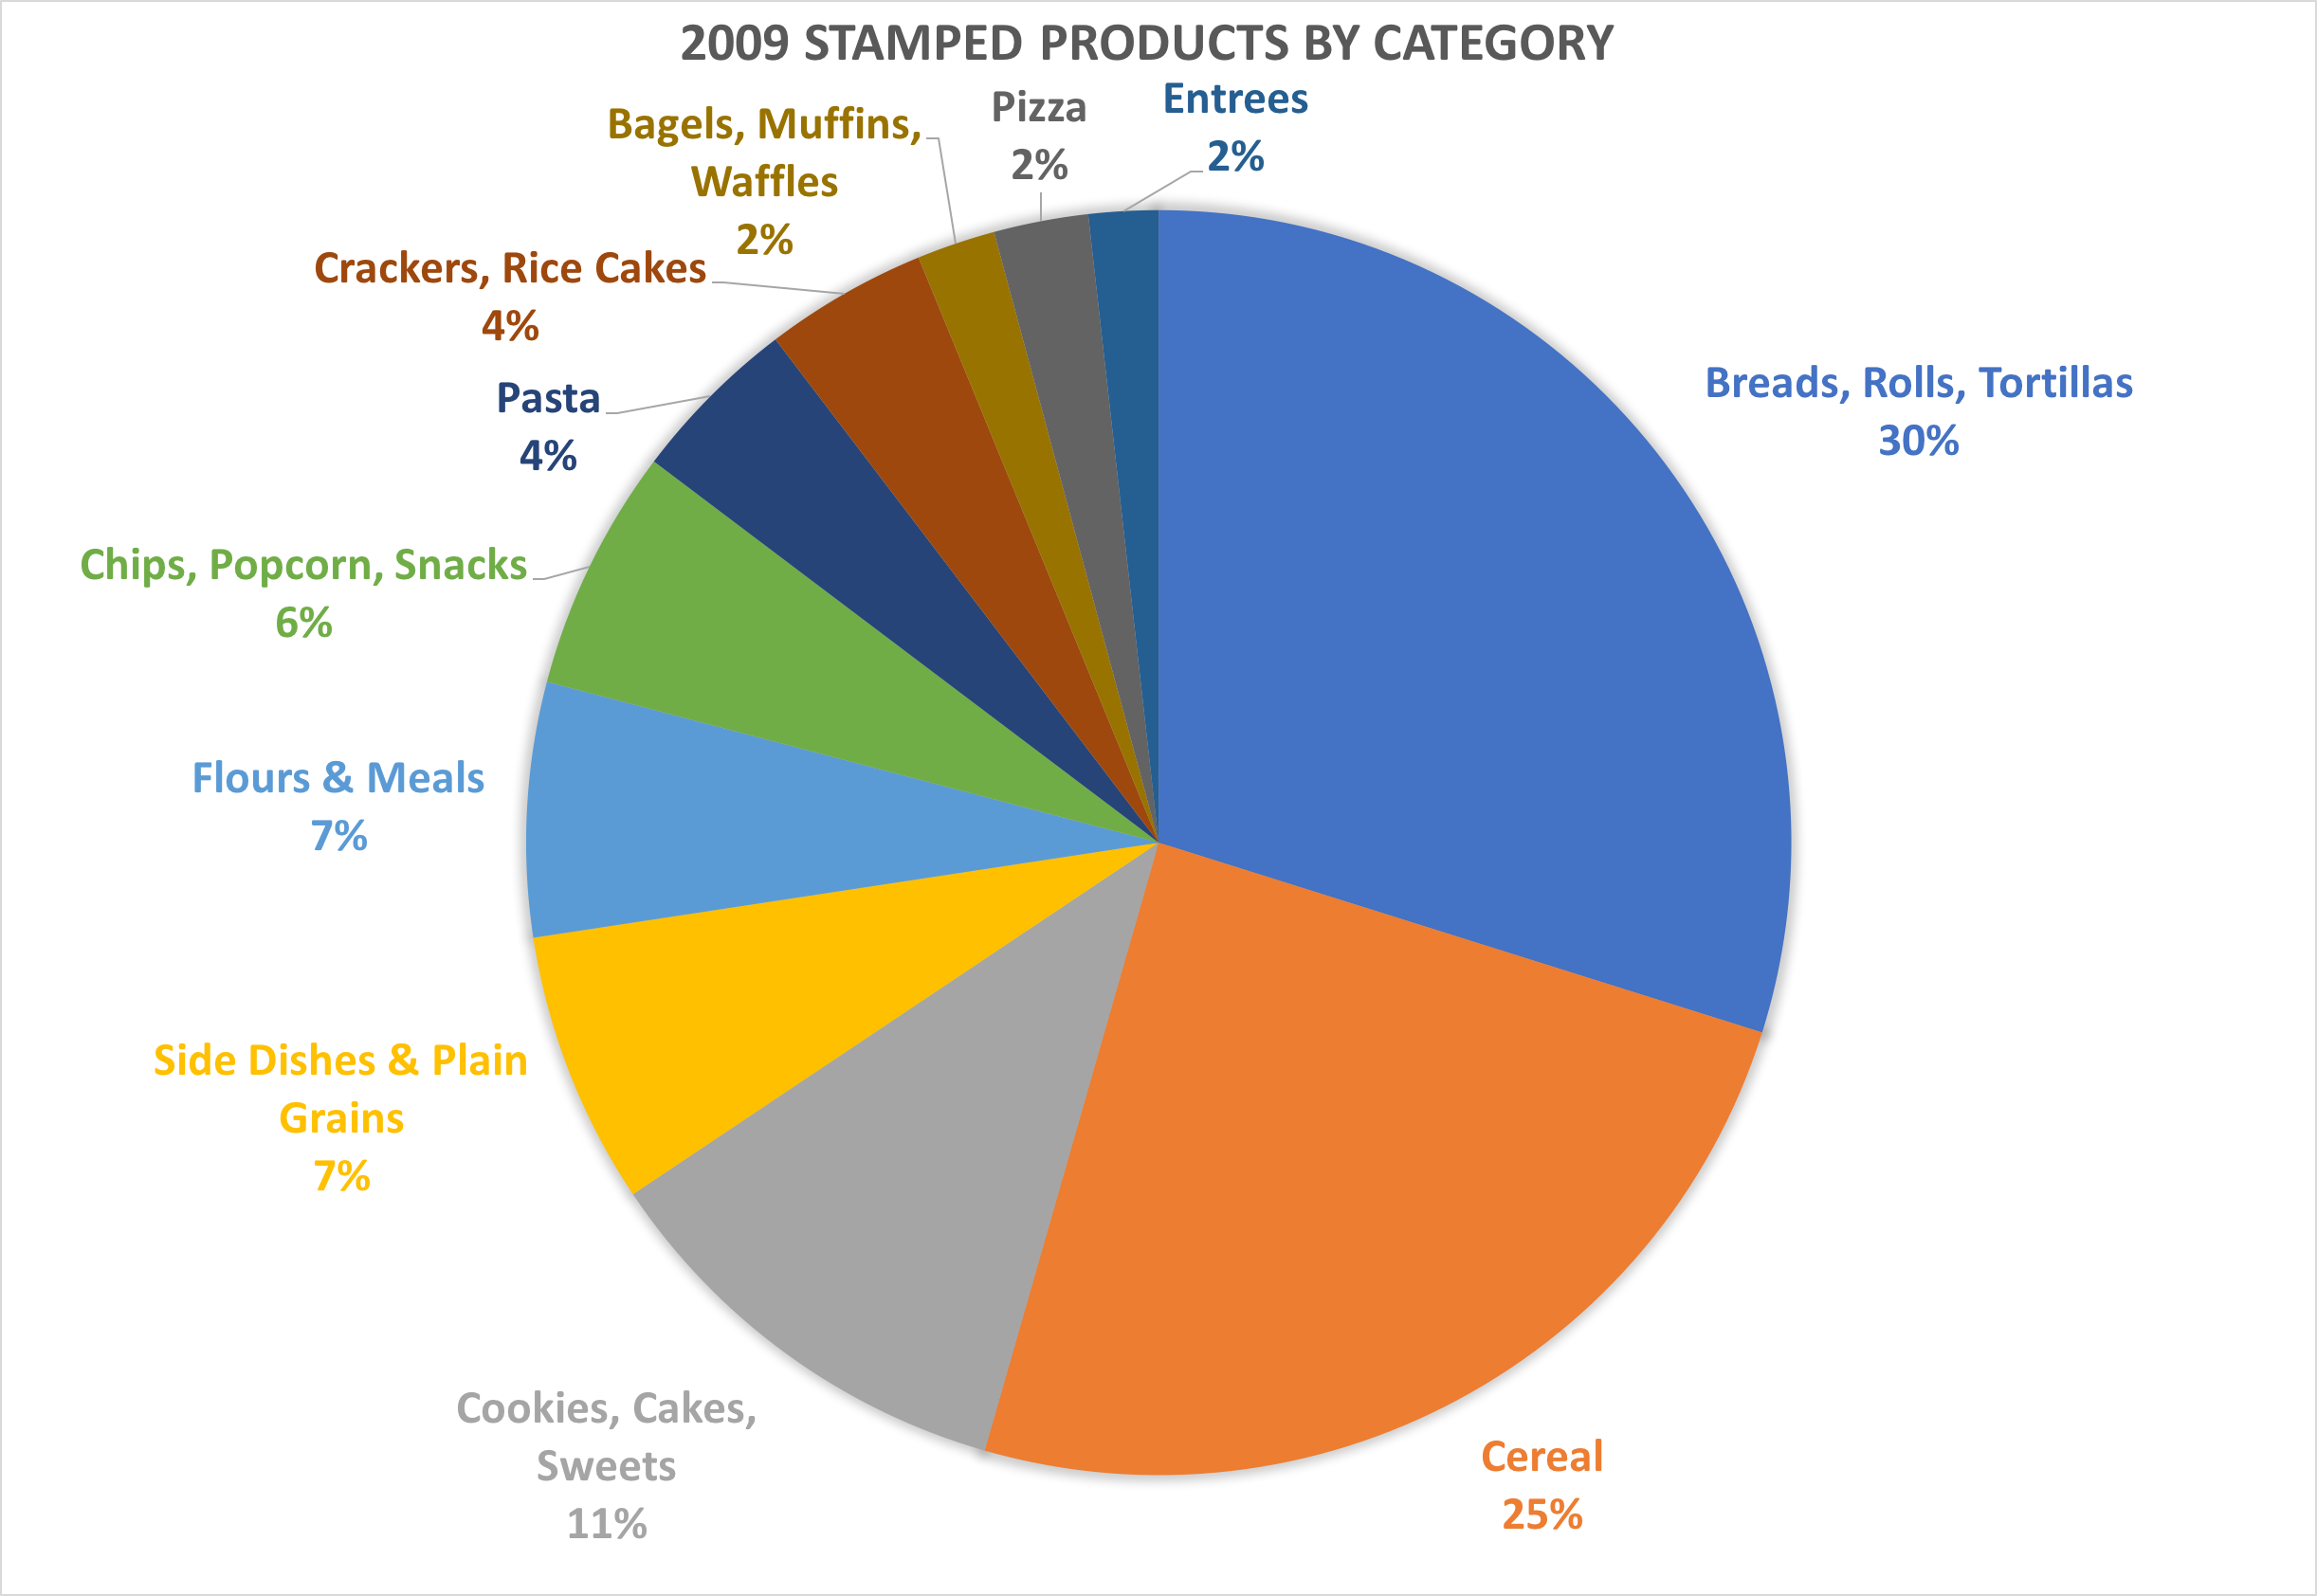
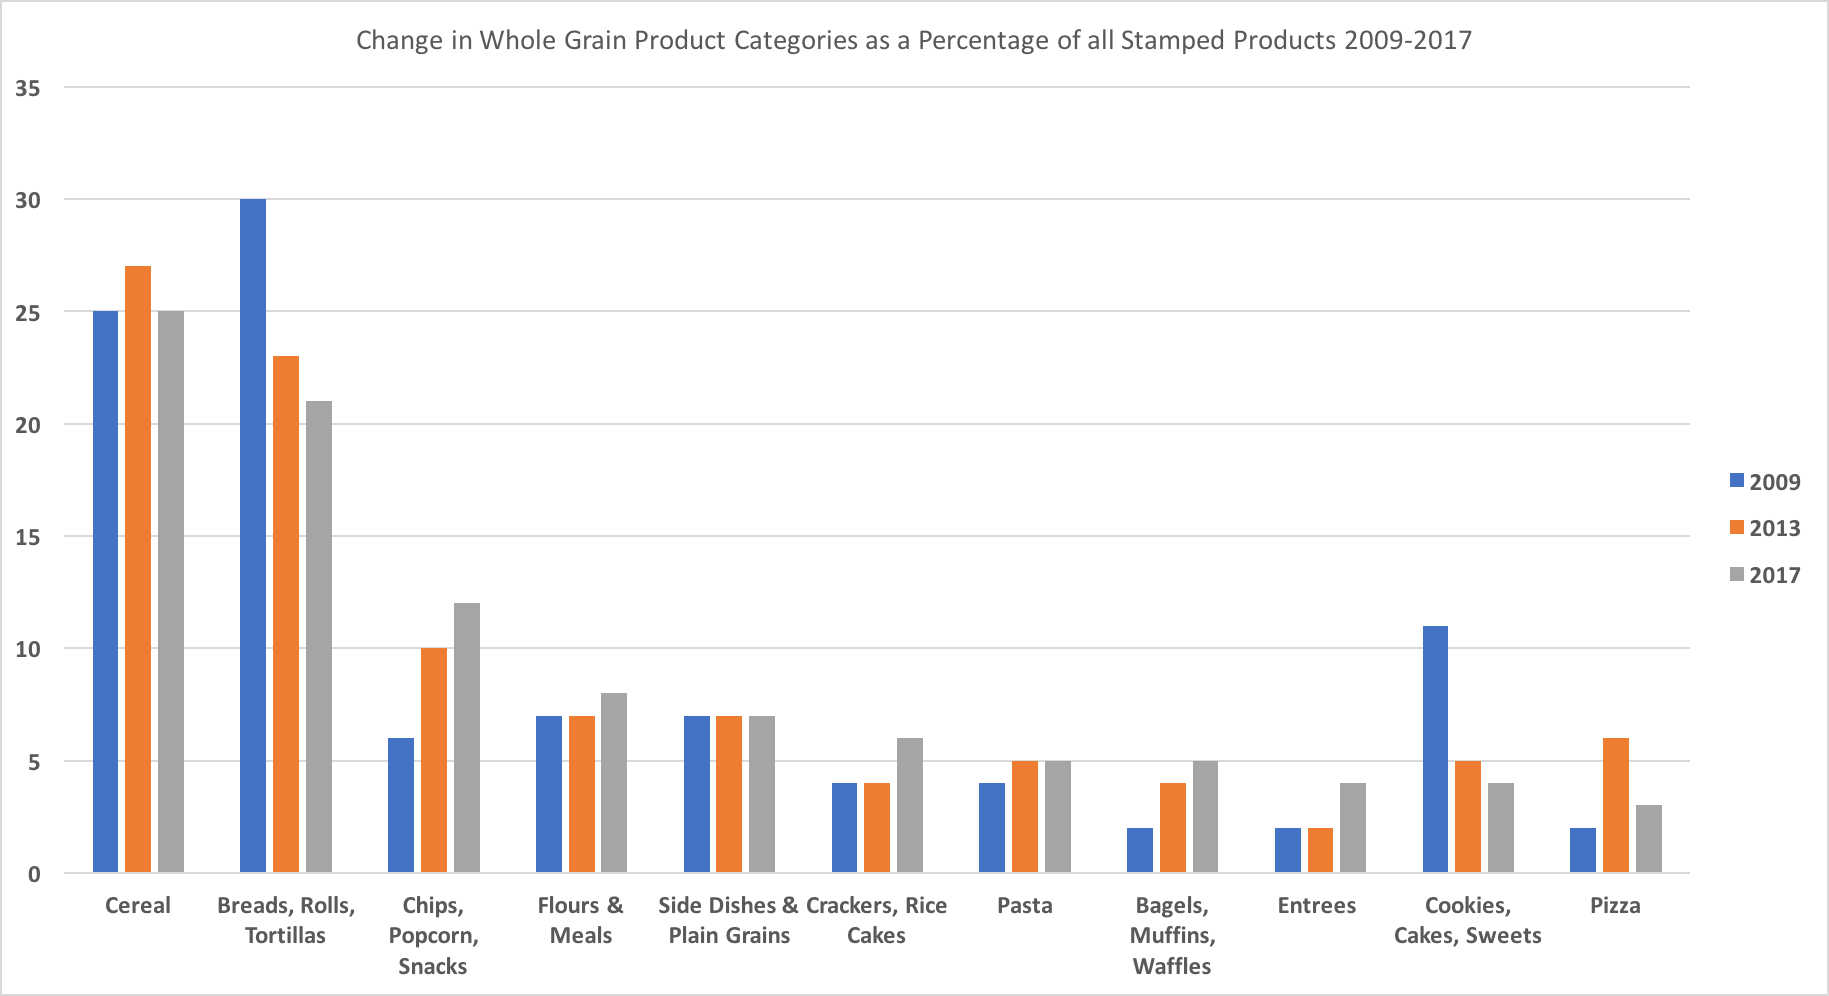
In 2009, products that fell into the category of breads, rolls, flatbreads, and tortillas made up 30% of all the products registered to use the Whole Grain Stamp. Eight years later, that percentage has dropped to 21%. Before you get worried, thinking that whole grain breads are disappearing from shelves, let me assure you that with 2,350 bread products using the Stamp, no one is in danger of losing their whole grain toast options. Instead, what has happened is that a bunch of other food categories that used to have only a handful of whole grain options have seen immense growth in recent years. Bread is corking along just one, but its relative percentage has decreased as other categories have expanded.
Let’s take chips, popcorn, and snack foods, for instance. Back in 2009, these snack options made up 6% of the products in our database and today that proportion has doubled. Consumers these days are still looking for tasty snack options, but they want their snacks to be healthy, too. The market for healthier, whole grain snacks has exploded in the last few years to meet this demand.
Similarly, ready-to-eat whole grain breakfast options like bagels, mufins, pancakes, and wafles were few and far between eight years ago, making up only 2% of all registered products, but today there are more than 500 choices on the market 5% of all products using the Whole Grain Stamp fall into this category.
To get the big picture, check out this graph showing the change in relative percent for each of the food categories in our database.
These changes in our database indicate that consumers looking to incorporate more whole grains into their diet have a lot to choose from. With hundreds of crackers, pastas, frozen entrees, and on-the-go breakfast options, eating whole grains has never been easier, or more delicious. We’d love to hear about your favorite whole grain products in the comments section below!
Caroline Sluyter, Whole Grain Stamp Program Manager


Leave a comment